 Collect information about your website and display it in
an easy-to-digest manner.
Features
This npm package displays statistics about your web pages, including Google PageSpeed Insights score, resources count, and recommendations on how to fix performance issues, html errors and much more in one custom view.
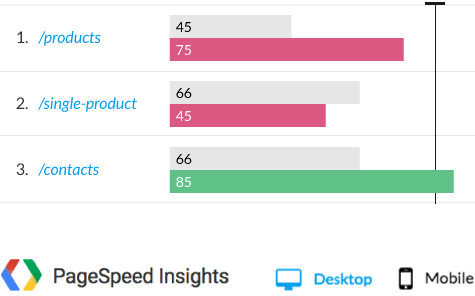
Test multiple pages simultaneously on Google PageSpeed Insights
With PerfTool you can run multiple tests for Google PageSpeed Insights. Then, compare results from previous tests, set a score threshold and get detailed reports about your tests.
View Sample Report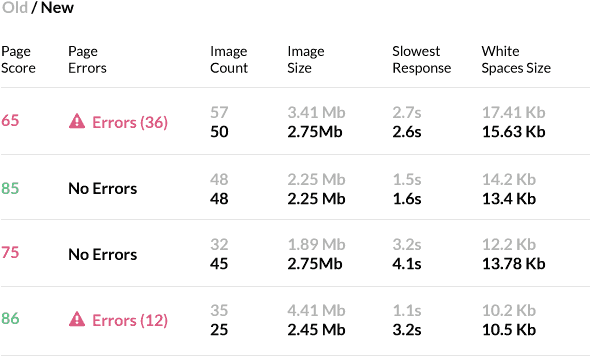
Get your page statistics
You can check your pages for html errors, get an external resources count and size, check load times and much more.
Over 200 data points
Installation
The PerfTool package is a combination of three plugins: Google PageSpeed Insights - to test page performance, dev-perf - to get statistics about your page, and w3cjs - to validate html.
npm install devbridge-perf-tool --save-dev
require('gulp').task('perf-tool', function () {
    var options = {
        siteURL:'http://www.google.com',
        sitePages: ['/', '/voice']
    };
    return require('devbridge-perf-tool').performance(options);
});
Additional information on the installation process and how to use the PerfTool is available on Devbridge Group’s github page.
Other Tools by Devbridge Group
